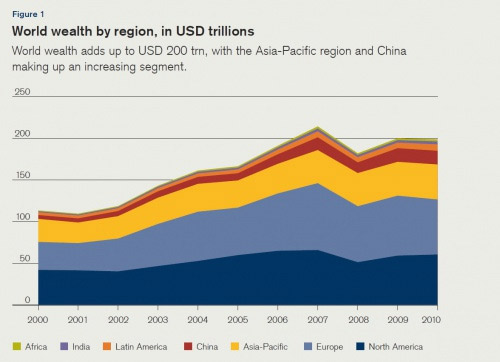
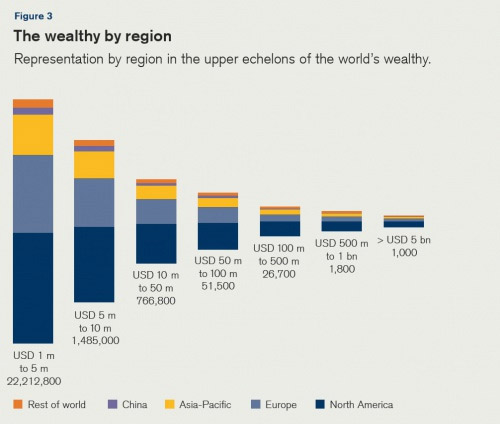
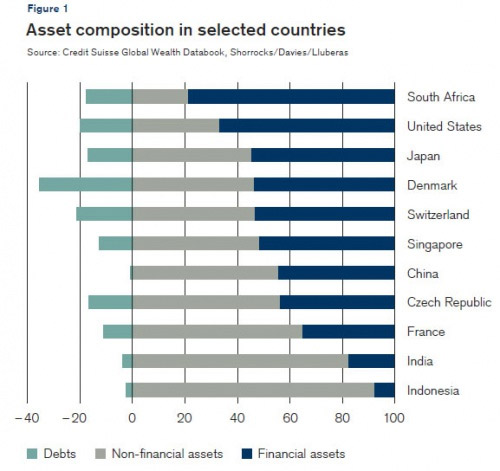
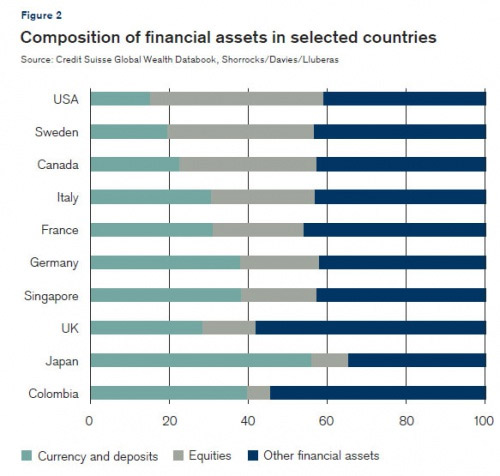
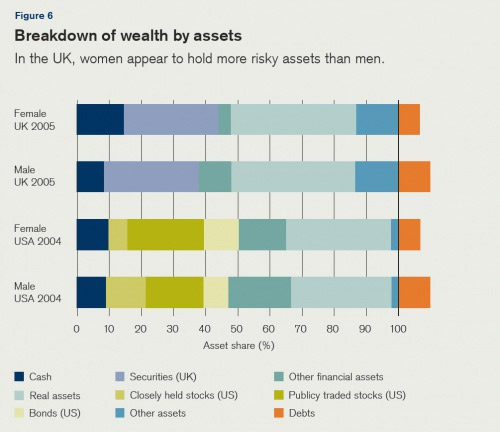
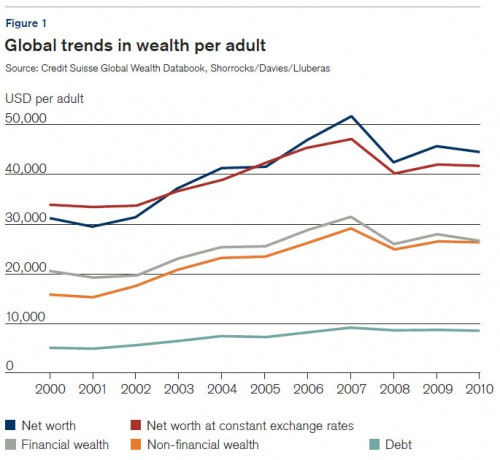
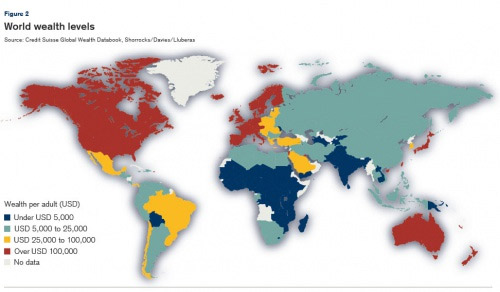
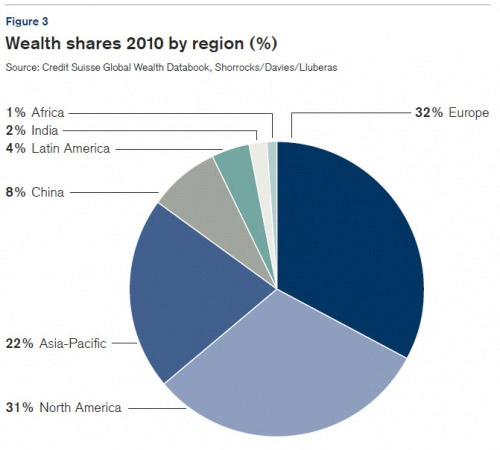
By now it should be common knowledge to everyone that in American society, the top wealthiest 1 percentile controls all the political power, holds half the wealth, and pays what is claimed to be the bulk of the taxes (despite mile wide tax loopholes and Swiss bank accounts). The rest of the population is merely filler, programmed to buy every latest self-cannibalizing iteration of the iPad/Pod while never again paying their mortgage and brainwashed to watch 2 hours of prime time TV commercials to keep it distracted from the fact that the last time America was a democracy was around the time the Wright brothers were arguing the pros and cons of frequent flier programs. So far so good. But what about the rest of the world? How is wealth stratified in a global perspective? Where do the "rich" live? What kind of wealth is controlled by various countries? Where are the Ultra High Net Worth people? For answers to all these questions, and much more, confirming that just like in America, the wealthiest 0.5% control over 35% of world wealth, Credit Suisse has compiled and released its latest "Global Wealth Report." The findings are summarized here. The first figure shows world wealth by region. The US, with its wealth of about $50 trillion, accounts for 25% of total world wealth, which at last check was about $200 trillion. And yes, Europe as a region has a slightly greater wealth portion (32%) than does America (31%). When it comes to geographic distribution, it is to be expected that North America will have the greatest proportion of people in the ultra wealthy category. Indeed, the chart below confirms this. Drilling down into asset composition in various countries, it becomes obvious why the Fed is so focused on keeping the stock market high. With America being the wealthiest country in the world, and the bulk of US wealth held in financial assets, offset by a material amount of debt, which confirms that a deflationary spiral would be the end for the "wealth effect" so desired by Ben Bernanke. More from CS: "Consider first the relative importance of financial versus non-financial assets, and the size of debt. Expressed as a percentage of gross household assets, the pattern clearly differs markedly between poorer and richer countries and regions. In developing countries (see Figure 1), for example India and Indonesia, it is common for 80% or more of total assets to be held in the form of non-financial assets, largely housing and farms. A high proportion of real property is also evident in transition countries in Europe, reflecting in part the wholesale privatization of housing in the 1990s. As countries develop and grow, the importance of non-financial assets tends to decline, so that the share in China, for instance, is now close to half. In the richest countries, financial assets typically account for more than half of household wealth. There are interesting exceptions to this general pattern. Recent robust house price rises have propelled the share of non-financial assets above 60% in France and some other major European countries. South Africa, on the other hand, is an outlier in the developing world, with exceptionally high holdings of financial assets: the figure of 80% exceeds the share found in both the United States and Japan." In other words, the more "developed" the world becomes, the greater the amount of wealth tied into the perpetuation of the Ponzi lies. Small wonder why so few in charge are willing to actually do anything that changes the status quo. Next, it is time to drill down in the specific composition of the financial assets. Figure 2 provides more detail, showing the breakdown of financial assets into three categories: currency and deposits, equities (all shares and other equities held directly by households), and other financial assets for selected countries. To add further detail, in most countries the reserves of life insurance companies and pension funds form the largest component of “other financial assets.” The composition of financial assets differs considerably across countries, especially with regard to the importance of shares and other equities. One interesting trend we note is that equities are not always a large component of household financial wealth, even in countries with very active financial markets. In the United Kingdom and Japan, for example, equities account for just 13% and 9% of total financial assets respectively. In contrast, they make up 37% and 43% of financial assets in Sweden and the USA, respectively. Broadly speaking, the relative importance of currency and deposits falls as that of bonds and equities increases. On the other hand, the portfolio share of “other financial assets” does not vary a lot, staying in the range of about 40%–45%. However, when we come to the UK, Japan and Colombia, which have the lowest portfolio share of equities, the pattern breaks down. The UK has a moderate currency and deposits share, but the largest “other financial assets” share, reflecting large life insurance and pension reserves. Colombia also has more in the form of “other financial assets” than is typical. Japan, on the other hand, which has a strong tradition of saving in deposit form, has a very large currency and deposits share and only a 35% share of “other financial assets.” An interesting detour looks at gender distribution for asset holders in the US and the UK. As the chart below shows, in the UK women appear to hold more risky assets than men. Looking at the history of global wealth per adult, net worth peaked just before the first ponzi/credit/housing bubble popped, confirming that a major portion of the then-record $50K/adult net wealth was imaginary. Yet it may have far more to drop: as CS says, "despite the financial crisis, the past decade has in fact been a relatively benign period for household wealth accumulation. Global net worth per adult rose 43% from USD 30,700 in the year 2000 to USD 43,800 by mid-2010. Since the number of adults increased from 3.6 billion to 4.4 billion over this period, aggregate household wealth rose by 72%. One important factor here was the depreciation of the dollar against most major currencies, which accounts for part of the rise in dollar-denominated values, but average net worth still increased by 24% when exchange rates are held constant." The next question is how much latent dollar devaluation has been accrued to this point and how much more is due to only gradually emerge. The next chart is rather self-explanatory. The richest nations, with wealth in 2010 above USD 100,000 per adult, are found in North America, Western Europe, and among the rich Asian-Pacific and Middle East countries. They are topped by Switzerland, Norway, Australia, Singapore and France, each of which records wealth per adult above USD 250,000. Average wealth in other major economies such as the USA, Japan, the United Kingdom and Canada also exceeds USD 200,000. And some more detail on the various wealth regions:
Emerging wealth: The band of wealth from USD 25,000 to USD 100,000 covers many recent EU entrants (Poland, Hungary, Czech Republic, Slovakia, Latvia, Lithuania, Estonia, Cyprus) and important Latin American countries (Mexico, Brazil, Chile), along with a number of Middle Eastern nations (Lebanon, Saudi Arabia, Bahrain). Frontier wealth: The main transition nations outside the EU, including China, Russia, Belarus, Georgia, Kazakhstan and Mongolia, fall in the USD 5,000 to USD 25,000 range, together with some of their Far East neighbors (Indonesia, Thailand) and most of Latin America (Colombia, Ecuador, Peru, El Salvador). The group also contains a number of African nations at the southernmost tip (South Africa, Botswana, Namibia) and on the Mediterranean coast (Morocco, Algeria, Tunisia, Egypt). Finally, the category below USD 5,000 comprises almost all of South Asia, including India, Pakistan, Bangladesh and Nepal, and almost all of Central and West Africa.
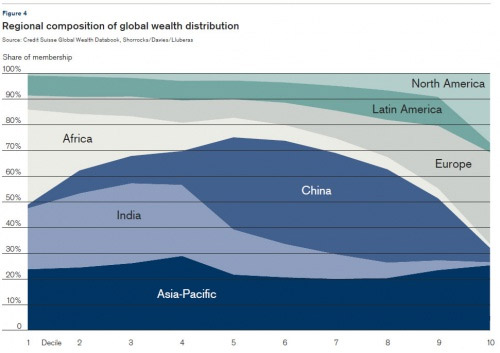
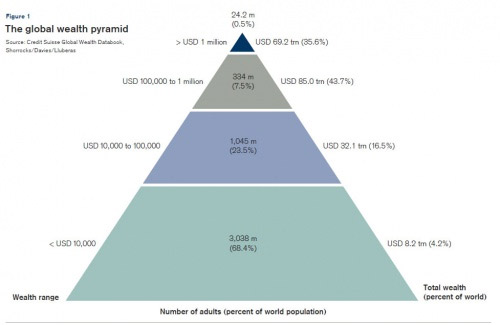
Next is a pie chart of with a detailed break down of wealth distribution by region. Credit Suisse provides a look at geographic wealth distribution by decile: To be among the wealthiest half of the world, an adult needs only USD 4,000 in assets, once debts have been subtracted. However, each adult requires more than USD 72,000 to belong to the top 10% of global wealth holders and more than USD 588,000 to be a member of the top 1%. The bottom half of the global population together possess less than 2% of global wealth, although wealth is growing fast for some members of this segment. In sharp contrast, the richest 10% own 83% of the world’s wealth, with the top 1% alone accounting for 43% of global assets. Figure 4 shows how the regions of the world are represented amongst the wealth deciles. Unsurprisingly for example, North America and Europe together make up the lion’s share of the top wealth decile (10%). China has relatively few representatives at the very top and bottom of the global wealth distribution, but dominates the middle section, supplying more than a third of those in deciles 4–8. The sizeable presence of China in the middle section reflects not only its population size and moderate average wealth level, but also relatively low wealth inequality. China’s position in the global picture has shifted upwards in the past decade as a consequence of a strong record of growth, rising asset values and the appreciation of the renminbi relative to the US dollar. China already has more people in the top 10% of global wealth holders than any country except for the USA, Japan and Germany, and is poised to overtake both Germany and Japan in the near future. Next is the chart that everyone has seen as it pertains to America, but few have seen in terms of the entire world. Per CS, Figure 1 shows “The global wealth pyramid” in striking detail. It is made up of a solid base of low wealth holders with upper tiers occupied by fewer and fewer people. We estimate that 3 billion individuals – more than two thirds of the global adult population – have wealth below USD 10,000. A further billion adults (24% of the world population) are placed in the USD 10,000–100,000 range, leaving 358 million adults (8% of the world population) with assets above USD 100,000. Figures for mid-2010 indicate that 24.2 million adults are above the threshold for dollar millionaires. While they make up less than 1% of the global adult population, they own more than a third of global household wealth. More specifically, individuals with wealth above USD 50 million are estimated to number 81,000 worldwide. Some more details on the various tiers of the pyramid:
Bottom of the pyramid The various tiers of the wealth pyramid have distinctive characteristics. The base level is spread broadly across countries. It has significant membership in all regions of the world, and spans a wide variety of family circumstances. The upper wealth limit of USD 10,000 is a modest sum in developed countries, excluding almost all adults who own houses, with or without a mortgage. Nevertheless, a surprisingly large number of individuals in advanced countries have limited savings or other assets. A high proportion are young people with little opportunity or interest in accumulating wealth. In fact, limited amounts of tangible assets combined with credit card debts and student loans lead many young people to record negative net worth. In Denmark and Sweden, for example, 30% of the population report negative wealth. This is an important and often overlooked segment, not least in the context of the credit crisis. Low wealth is also a common feature of older age groups, particularly for those individuals suffering ill health and exposed to high medical bills. In fact, the means testing applied to many state benefits, especially contributions to the cost of residential homes, provides an incentive to shed wealth. Nevertheless, relatively few people in rich countries have net worth below USD 10,000 throughout their adult life. In essence, membership of the base section of the global wealth pyramid is a transient, lifecycle phenomenon for most citizens in the developed world. The situation in low-income countries is different. More than 90% of the adult population in India and Africa fall in this band; in many low-income African countries, the fraction of the population is close to 100%. However, the cost of living is usually much lower. For a resident of India, for instance, assets of USD 10,000 would be equivalent to about USD 30,000 to a resident of the United States. In much of the developing world, this is enough to own a house or land – albeit possibly with uncertain property rights – and to have a comfortable lifestyle by local standards. Middle of the pyramid The billion adults in the USD 10,000–100,000 range form the middle class from the perspective of global wealth. With USD 32 trillion in total wealth, it certainly carries economic weight. This tier has the most regionally balanced membership, although China now contributes almost a third of the total. The wealth range would cover the median person over most of his adult life in high income countries. In middle income countries it would apply to a middle class person in middle age. However, in low-income countries only those in the top decile qualify, restricting membership to significant landowners, successful businessmen, professionals and the like. High segment of the pyramid When we consider the “high” segment of the wealth pyramid – the group of adults whose net worth exceeds USD 100,000 – the regional composition begins to change. With almost 358 million adults worldwide, this group is far from exclusive. But the typical member of the group is very different in different parts of the world. In high income countries, the threshold of USD 100,000 is well within the reach of middle-class adults once careers have been established. In contrast, residents from low-income countries would need to belong to the top percentile of wealth holders, so only the exceptionally successful, well endowed or well connected qualify. The regional contrast shows up in the fact that North America, Europe and the Asia-Pacific regions account for 92% of the global membership of the USD 100,000+ group, with Europe alone home to 39% of the total. As far as individual countries are concerned, the membership ranking depends on three factors: the population size, the average wealth level, and wealth inequality within the country. Only 15 countries host more than 1% of the global membership. The USA comes top with 23% of the total. All three factors reinforce each other in this instance: a large population combining with high mean wealth and an unequal wealth distribution. Japan is a strong runner-up, the only country at present to seriously challenge the hegemony of the USA in the global wealth ranking. Although its relative position has declined since the year 2000 due to lackluster stock market and housing market performance, Japan is still home to 15% of individuals with wealth above USD 100,000. Top of the pyramid At the top of the pyramid, we find the world’s millionaires, where we again witness a slightly different pattern of membership. The proportion of members from the United States rises sharply to 41%, and the share of members from outside of the North America, Europe and Asia-Pacific regions falls to just 6%. The relative positions of most countries move downwards, but there are exceptions. The French share is estimated to double to 9%, while Sweden and Switzerland are each now credited with more than 1% of the global membership.
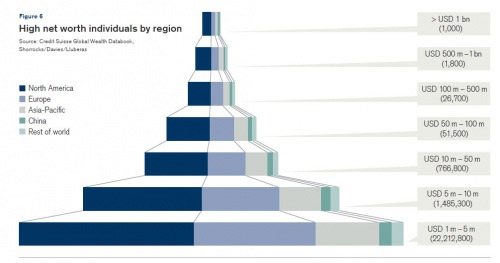
And next, is a detailed look at the very top of the pyramid: those individuals which have over 1 million in net worth.
To assemble details of the pattern of wealth holdings above USD 1 million requires a high degree of ingenuity. The usual sources of data – official statistics and sample surveys – become increasingly incomplete and unreliable at high wealth levels. A growing number of publications have followed the example of Forbes magazine by constructing “rich lists,” which attempt to value the assets of particular named individuals at the apex of the wealth pyramid. But very little is known about the global pattern of asset holdings in the high net worth (HNW – greater than USD 1 million) and ultra high net worth (UHNW – from USD 50 million upwards) range. We bridge this gap by exploiting well-known statistical regularities in the top wealth tail. Using only data from traditional sources in the public domain yields a pattern of global wealth holdings in the USD 250,000 to USD 5 million range, which, when projected onward, predicts about 1000 dollar billionaires for mid-2010. Although not exactly comparable, this number is very close to the figure of 1,011 billionaire holdings reported by Forbes magazine for February 2010. Making use of the regional affiliation recorded in rich lists allows us to merge the top tail details with data on the level and distribution of wealth derived from traditional sources in order to generate a regional breakdown of HNW and UHNW individuals. At this time, we do not attempt to estimate the pattern of holdings across particular countries, except China and India which are treated as separate regions. However, as a rule of thumb, residents of the USA account for about 90% of the figure for North America. The base of the wealth pyramid is occupied by people from all countries of the world at various stages of their lifecycle. In contrast, HNW and UHNW individuals are heavily concentrated in particular regions and countries, but the members tend to share a much more similar lifestyle, often participating in the same global markets for high coupon consumption items. The wealth portfolios of individuals are also likely to be similar, dominated by financial assets and, in particular, equity holdings in public companies traded in international markets. For these reasons, using official exchange rates to value assets is more appropriate, rather than using local price levels to compare wealth holdings. Our figures for mid-2010 indicate that there were 24.5 million HNW individuals with wealth from USD 1 million to USD 50 million, of whom the vast majority (22 million) fall in the USD 1–5 million range. North America dominates the residence ranking, accounting for 11.1 million HNW individuals (45% of the total). Europe accounts for 7.8 million (31.7%) and 4.1 million reside in Asia-Pacific countries other than China and India. We estimate that there are now more than 800,000 HNW individuals in China, each worth between USD 1 million and USD 50 million (3.3% of the global total). India, Africa and Latin America together host the remaining 740,000 HNW individuals (3.0% of the total).
The take home message is that the wealthiest people in the world have the bulk of their wealth entrenched in the current system and any dramatic overhaul or reset of the status quo will be met by the stiff resistance of those who can summon fleet of jets, private armies, and even Fed chairmen on a whim. Whether anyone will have the wherewithal to confront the broken system under such conditions remains to be seen. And for those seeing more granular detail by country, below are the profiles of the 15 or so wealhtiest countries. Abridged Wealth Distribution