

Pasadena, CA – Geologists have a new tool to study how earthquakes change the landscape, giving them insight into how earthquake faults behave. In the February 10th issue of the journal Science, a team of scientists from the United States, Mexico, and China, including geophysicist Eric Fielding of NASA’s Jet Propulsion Laboratory (JPL), reports the most comprehensive before-and-after documentation yet of an earthquake zone, using data from the magnitude 7.2 event that struck near Mexicali, northern Mexico in 2010.
"This study provides new information on how rocks in and around fault zones are deformed during earthquakes," said Fielding. "It helps scientists understand past events and assess the likelihood of future earthquakes in other complex systems of faults."
The team, working with the National Center for Airborne Laser Mapping, flew over the area with lidar (light detection and ranging), which bounces laser pulses off the ground and measures their reflection to determine the height of the surface. New airborne lidar equipment can measure features in the surface height to within a few inches.
The researchers were able to make a detailed scan after the earthquake over about 140 square miles (363 square kilometers) in less than three days, said Michael Oskin, geology professor at the University of California, Davis. He is the lead author of the study, which was funded by the National Science Foundation, the US Geological Survey, Consejo Nacional de Ciencia y Tecnología (Mexico) and NASA.
Oskin said that they knew the area had been mapped with lidar in 2006 by the Mexican government. When the earthquake occurred, Oskin and Ramon Arrowsmith at Arizona State University, Tempe, applied for and got funding from the National Science Foundation to carry out an immediate aerial survey of the previously mapped area.
Co-authors John Fletcher and graduate student Orlando Teran from the Centro de Investigación Científica y de Educación Superior de Ensenada (CICESE) carried out a traditional ground survey of the fault rupture, which helped guide planning of the aerial lidar survey and the interpretation of the results.
By comparing pre- and post-earthquake surveys, the team members could see exactly where the ground moved and by how much. The survey revealed deformation around the system of small faults that caused the earthquake and allowed measurements that provide clues to understanding how these multi-fault earthquakes occur.
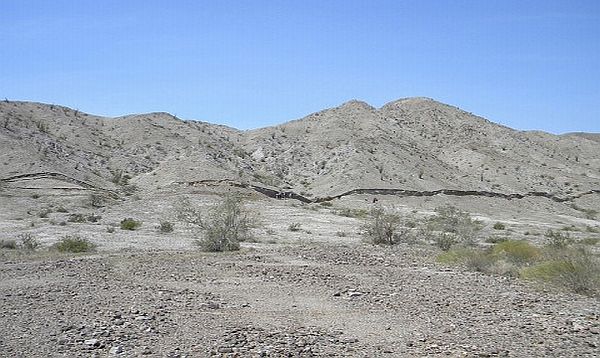
The 2010 Mexicali earthquake did not occur on a major fault, like the San Andreas, but ran through a series of smaller faults in the Earth’s crust. These minor faults are common around major faults but are underappreciated. "This sort of earthquake happens out of the blue, but the new lidar survey shows how seven of these small faults came together to cause a major earthquake," Oskin said.
Since 2009, JPL has been flying its airborne Uninhabited Aerial Vehicle Synthetic Aperture Radar (UAVSAR) over the California border region to measure ground deformation in the area. UAVSAR, which flies on a NASA Gulfstream III aircraft, uses a different technique — interferometric synthetic aperture radar — to measure ground deformation over large areas to a precision of 0.1 to 0.5 centimeters (0.04 to 0.2 inches). UAVSAR flew repeat GPS-guided passes over the California side of the border region twice in 2009 and six times since the Baja quake, imaging it and its continuing deformation since.
Fielding said NASA recently secured approvals from the Mexican government and began flying UAVSAR south of the California border over the Baja California earthquake zone in 2012. These flights will be conducted every three months to monitor fault movements.